Mapbox
A Mapbox térképszolgáltatóknak kínál megoldásokat, illetve emellett térképek tervezéséhez és karbantartásához készít eszközöket. Ezek többnyire OpenStreetMap adatokat használnak. A Mapbox elkötelezett a nyílt megoldások mellett, de nem csak használja az adatokat, hanem többek között a Mapnik nyílt forrású térképrenderelő megoldás kódjának fő hozzájárulója is.
Tartalomjegyzék
- 1 Mapbox, mint cég
- 2 Árazás
- 3 Fejlődéstörténet
- 4 Példák (Mapbox.js)
- 4.1 Térkép (kezdő szint)
- 4.1.1 Minimális példa egy térkép megjelenítésére
- 4.1.2 Világtérkép folytonosságának kikapcsolása
- 4.1.3 Változtatható alapréteg
- 4.1.4 Térkép nagyításának és mozgatásának letiltása
- 4.1.5 Megnézhető térképterület leszűkítése határokkal
- 4.1.6 Dupla kattintásra nagyítás az adott területre középre helyezve + aránymérték
- 4.1.7 Töltésjelző megjelenítése
- 4.2 Jelölők a térképen
- 4.3 Tippek, üzenetek, szövegek
- 4.4 Helyek
- 4.5 Útvonaltervezés (Autós, biciklis, gyalogos közlekedéssel)
- 4.6 Plugin támogatás és a Mapbox
- 4.1 Térkép (kezdő szint)
- 5 Az újabb irányvonal: a Mapbox GL JS megvalósítása és működése a háttérben
- 6 Példák (Mapbox GL JS)
- 7 Felhasználás, alkalmazás
- 8 Források
Mapbox, mint cég
Történelem
A cég startupként indult 2010-ben, Washingtonban. Dolgozóinak száma 2017-re elérte a 180 főt (az első negyedév végére 199 fő). Főként dizájnerek, szoftver fejlesztők és térképészek. Mára több, mint 5000 üzleti és 200000 ingyenes ügyfelük és felhasználójuk van. Olyan cégek valamint szervezetek használják a termékeiket, mint a Foursquare, Evernote, Pinterest, Github, The Weather Channel, Guardian, Financial Times, CNN, Greenpeace, National Geographic. Hisznek az open-source fejlesztésekben, ezért jelenleg 440-nél is több publikus repójuk van a GitHubon.
Munkásság
Egy olyan eljáráson dolgoznak, amivel a műholdképek minősége feljavítható. Ha most bárki megnyitja a Google Maps vagy a Bing Maps térképeit, átkapcsol műholdas nézetbe, akkor azt veheti észre, hogy az egész Földön mindenhol világos van, mindenhol nyár van és nincsenek felhők. Ha elkezdünk visszaközelíteni, akkor kiderül, hogy sokszor nagy kontraszteltérés van egymás mellett lévő sávok közt, feltűnnek felhők, a színek össze-vissza változnak és sok esetben a képek rossz minőségűek. Ez annak köszönhető, hogy ezek a térképek ezernyi kis darabból vannak összerakva. Előfordul, hogy az egymás melletti képek teljesen más forrásból származnak, más technológiával készültek, illetve időben akár évekre van egymástól két szomszédos darab. A Mapbox azt tűzte ki célul, hogy felszámolja az ilyen hibákat, megszabadulva a zavaró felhőktől és grafikai egyenetlenségektől. Ennek megvalósításához az alapanyag a NASA Lance-Modis rendszerének műholdjáról származik. A Mapbox ezekből az adatokból ragadta ki a 2011. január 1. és 2012. december 31. közt készült két évnyi anyagokat. Ez 339 ezer darab 16 megapixeles képet jelent, ami több mint 5687 milliárd pixel összességében. A projekt célja, ezt a pixelmennyiséget lefésülni 5 milliárd pixelnyire, amiből összeáll egy részletes, de egységes glóbusz.
Külön tájékoztató oldal a logójukról és a nevükről
A cég precízen figyel a nevüket és logójukat érintő pontosságra. Épp ezért egy külön oldal hoztak létre ezek helyes használatáról. A szemléletesség kedvéért összeszedtek néhány korábban előjött, helytelen példát is.
A Mapbox tájékoztató oldala a helyes logó- és névhasználatról
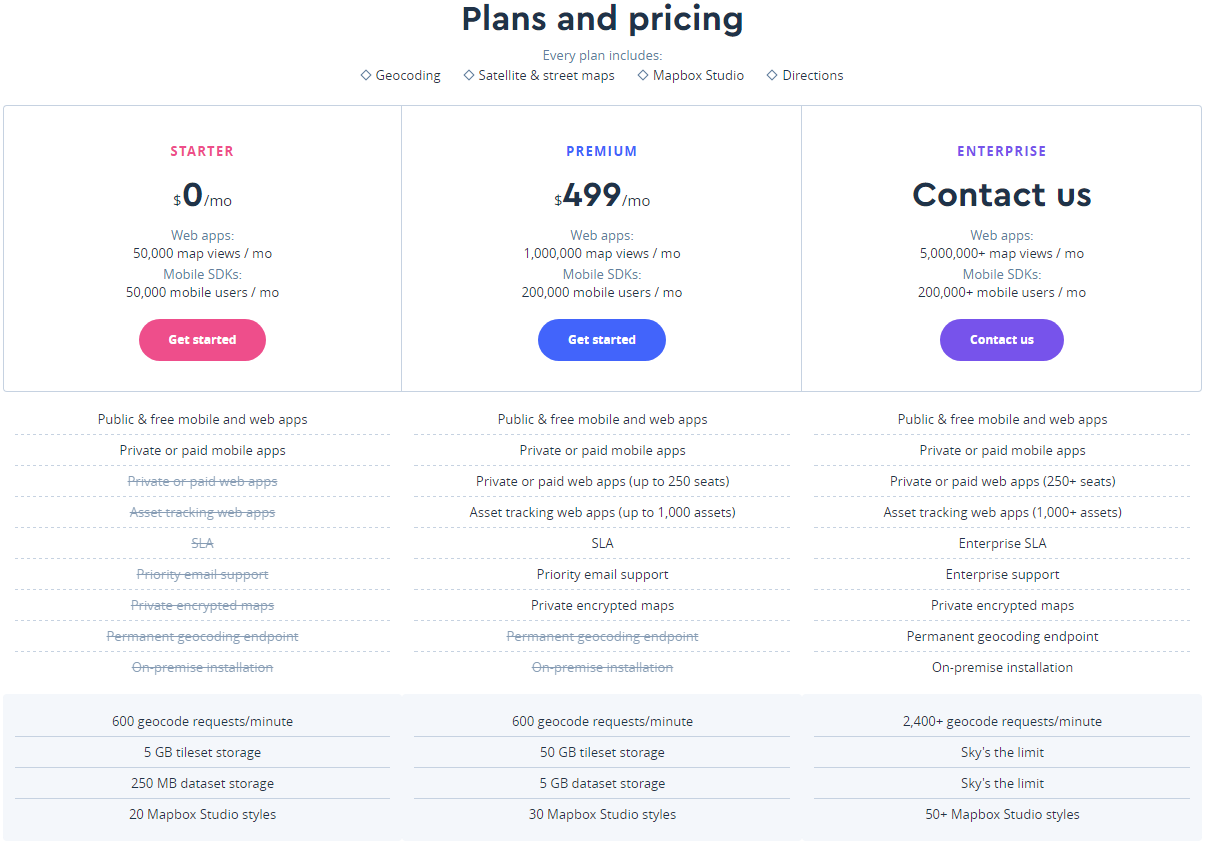
Árazás
A Mapbox jelenleg háromféle csomagban nyújtja a termékeit és szolgáltatásait. Ezek épp úgy lefedik a kisebb igényű, hobbicélú felhasználókat, mint a komoly ipari igényű céges felhasználókat.
Csomagok összehasonlítása
Fejlődéstörténet
A Mapbox a fejlődését tekintve az alábbiak szerint különíthető el részekre/modulokra/termékekre (időrendben felsorolva, illetve a legfontosabb tulajdonságaikkal):
- Mapbox.js (JavaScript, előgenerált raszteres csempék, Leaflet kompatibilitás)
- Mapbox GL (vektoros, OpenGL alapú, kliensoldali renderelés)
- Mapbox GL JS (JavaScript, WebGL, kliensoldali renderelés)
Mivel a Mapbox.js és a Mapbox GL JS is JavaScript alapú megoldás, ezért fontos lehet a kettő közti átjárhatóság. Ez azt jelenti, hogy ugyan nem automatikusan, de manuálisan a régebbi Mapbox.js projektek átalakíthatóak az újabb Mapbox GL JS alapú működésre. Ehhez a konverzióhoz az alábbi link nyújt hivatalos segítséget:
Converting a project from Mapbox.js to Mapbox GL JS
Példák (Mapbox.js)
Térkép (kezdő szint)
Minimális példa egy térkép megjelenítésére
<!-- A simple map -->
<!-- Initialize a map in an HTML element with Mapbox.js. -->

<!DOCTYPE html>
<html>
<head>
<meta charset=utf-8 />
<title>A simple map</title>
<meta name='viewport' content='initial-scale=1,maximum-scale=1,user-scalable=no' />
<script src='https://api.mapbox.com/mapbox.js/v3.0.1/mapbox.js'></script>
<link href='https://api.mapbox.com/mapbox.js/v3.0.1/mapbox.css' rel='stylesheet' />
<style>
	body { margin:0; padding:0; }
	#map { position:absolute; top:0; bottom:0; width:100%; }
</style>
<script>
	var demoAccessToken = 'pk.eyJ1IjoibWFwYm94IiwiYSI6ImNpejh2N21nMzAxMmQzMnA5emRyN2lucW0ifQ.jSE-g2vsn48Ry928pqylcg' || 'pk.eyJ1IjoibWFwYm94IiwiYSI6ImNpejY4M29iazA2Z2gycXA4N2pmbDZmangifQ.-g_vE53SD2WrJ6tFX7QHmA';
</script>
</head>
<body>
<div id='map'></div>
<script>
	L.mapbox.accessToken = '<your access token here>';
	L.mapbox.accessToken = demoAccessToken;
	var map = L.mapbox.map('map', 'mapbox.streets')
		.setView([47.47, 19.06], 15);
</script>
</body>
</html>
Világtérkép folytonosságának kikapcsolása
<!-- Disable world wrapping -->
<!-- Instead of loading tiles beyond -180 and 180, only show one copy of the world. -->

<!DOCTYPE html>
<html>
<head>
<meta charset=utf-8 />
<title>Disable world wrapping</title>
<meta name='viewport' content='initial-scale=1,maximum-scale=1,user-scalable=no' />
<script src='https://api.mapbox.com/mapbox.js/v3.0.1/mapbox.js'></script>
<link href='https://api.mapbox.com/mapbox.js/v3.0.1/mapbox.css' rel='stylesheet' />
<style>
	body { margin:0; padding:0; }
	#map { position:absolute; top:0; bottom:0; width:100%; }
</style>
<script>
	var demoAccessToken = 'pk.eyJ1IjoibWFwYm94IiwiYSI6ImNpejh2N21nMzAxMmQzMnA5emRyN2lucW0ifQ.jSE-g2vsn48Ry928pqylcg' || 'pk.eyJ1IjoibWFwYm94IiwiYSI6ImNpejY4M29iazA2Z2gycXA4N2pmbDZmangifQ.-g_vE53SD2WrJ6tFX7QHmA';
</script>
</head>
<body>
<div id='map'></div>

<script>
	L.mapbox.accessToken = '<your access token here>';
	L.mapbox.accessToken = demoAccessToken;
	var map = L.mapbox.map('map', 'mapbox.streets', {
		// These options apply to the tile layer in the map.
		tileLayer: {
			// This map option disables world wrapping. by default, it is false.
			continuousWorld: false,
			// This option disables loading tiles outside of the world bounds.
			noWrap: true
		}
	}).setView([40, 0], 2);
</script>
</body>
</html>
Változtatható alapréteg
<!-- Toggling baselayers -->
<!-- Toggling between three different baselayers. -->

<!DOCTYPE html>
<html>
<head>
<meta charset=utf-8 />
<title>Toggling baselayers</title>
<meta name='viewport' content='initial-scale=1,maximum-scale=1,user-scalable=no' />
<script src='https://api.mapbox.com/mapbox.js/v3.0.1/mapbox.js'></script>
<link href='https://api.mapbox.com/mapbox.js/v3.0.1/mapbox.css' rel='stylesheet' />
<style>
  body { margin:0; padding:0; }
  #map { position:absolute; top:0; bottom:0; width:100%; }
</style>
<script>
var demoAccessToken = 'pk.eyJ1IjoibWFwYm94IiwiYSI6ImNpejh2N21nMzAxMmQzMnA5emRyN2lucW0ifQ.jSE-g2vsn48Ry928pqylcg' || 'pk.eyJ1IjoibWFwYm94IiwiYSI6ImNpejY4M29iazA2Z2gycXA4N2pmbDZmangifQ.-g_vE53SD2WrJ6tFX7QHmA';
</script>
</head>
<body>
<div id='map'></div>

<script>
L.mapbox.accessToken = '<your access token here>';
L.mapbox.accessToken = demoAccessToken;
  var map = L.mapbox.map('map', null, {
      maxZoom: 18
  }).setView([22.76, -25.84], 3);

  var layers = {
      Streets: L.mapbox.tileLayer('mapbox.streets'),
      Outdoors: L.mapbox.tileLayer('mapbox.outdoors'),
      Satellite: L.mapbox.tileLayer('mapbox.satellite')
  };

  layers.Streets.addTo(map);
  L.control.layers(layers).addTo(map);
</script>
</body>
</html>
Térkép nagyításának és mozgatásának letiltása
<!-- Disable zooming and panning -->
<!-- How to disable zooming and panning with Mapbox.js, our open source JavaScript library. -->

<!DOCTYPE html>
<html>
<head>
<meta charset=utf-8 />
<title>Disable zooming and panning</title>
<meta name='viewport' content='initial-scale=1,maximum-scale=1,user-scalable=no' />
<script src='https://api.mapbox.com/mapbox.js/v3.0.1/mapbox.js'></script>
<link href='https://api.mapbox.com/mapbox.js/v3.0.1/mapbox.css' rel='stylesheet' />
<style>
  body { margin:0; padding:0; }
  #map { position:absolute; top:0; bottom:0; width:100%; }
</style>
<script>
	var demoAccessToken = 'pk.eyJ1IjoibWFwYm94IiwiYSI6ImNpejh2N21nMzAxMmQzMnA5emRyN2lucW0ifQ.jSE-g2vsn48Ry928pqylcg' || 'pk.eyJ1IjoibWFwYm94IiwiYSI6ImNpejY4M29iazA2Z2gycXA4N2pmbDZmangifQ.-g_vE53SD2WrJ6tFX7QHmA';
</script>
</head>
<body>
<div id='map'></div>

<script>
L.mapbox.accessToken = '<your access token here>';
L.mapbox.accessToken = demoAccessToken;
var map = L.mapbox.map('map', 'mapbox.streets', {
  zoomControl: false
}).setView([41.0252, 28.9950], 11);

// Disable drag and zoom handlers.
map.dragging.disable();
map.touchZoom.disable();
map.doubleClickZoom.disable();
map.scrollWheelZoom.disable();
map.keyboard.disable();

// Disable tap handler, if present.
if (map.tap) map.tap.disable();
</script>
</body>
</html>
Megnézhető térképterület leszűkítése határokkal
Using maxBounds to restrict map panning
<!-- Using maxBounds to restrict map panning -->
<!-- Preventing users from leaving an area on the map -->

<!DOCTYPE html>
<html>
<head>
<meta charset=utf-8 />
<title>Using maxBounds to restrict map panning</title>
<meta name='viewport' content='initial-scale=1,maximum-scale=1,user-scalable=no' />
<script src='https://api.mapbox.com/mapbox.js/v3.0.1/mapbox.js'></script>
<link href='https://api.mapbox.com/mapbox.js/v3.0.1/mapbox.css' rel='stylesheet' />
<style>
  body { margin:0; padding:0; }
  #map { position:absolute; top:0; bottom:0; width:100%; }
</style>
<script>
var demoAccessToken = 'pk.eyJ1IjoibWFwYm94IiwiYSI6ImNpejh2N21nMzAxMmQzMnA5emRyN2lucW0ifQ.jSE-g2vsn48Ry928pqylcg' || 'pk.eyJ1IjoibWFwYm94IiwiYSI6ImNpejY4M29iazA2Z2gycXA4N2pmbDZmangifQ.-g_vE53SD2WrJ6tFX7QHmA';
</script>
</head>
<body>
<div id='map'></div>

<script>
L.mapbox.accessToken = '<your access token here>';
L.mapbox.accessToken = demoAccessToken;
// Construct a bounding box for this map that the user cannot
// move out of
var southWest = L.latLng(46.47, 17.06),
    northEast = L.latLng(48.47, 21.06),
    bounds = L.latLngBounds(southWest, northEast);

var map = L.mapbox.map('map', 'mapbox.streets', {
    // set that bounding box as maxBounds to restrict moving the map
    // see full maxBounds documentation:
    // http://leafletjs.com/reference.html#map-maxbounds
    maxBounds: bounds,
    maxZoom: 19,
    minZoom: 10
});

// zoom the map to that bounding box
map.fitBounds(bounds);
</script>
</body>
</html>
Dupla kattintásra nagyítás az adott területre középre helyezve + aránymérték
<!-- Double click to zoom -->
<!-- Listen for a double click event from a user and zoom in on the map. -->

<!DOCTYPE html>
<html>
<head>
<meta charset=utf-8 />
<title>Double click to zoom</title>
<meta name='viewport' content='initial-scale=1,maximum-scale=1,user-scalable=no' />
<script src='https://api.mapbox.com/mapbox.js/v3.0.1/mapbox.js'></script>
<link href='https://api.mapbox.com/mapbox.js/v3.0.1/mapbox.css' rel='stylesheet' />
<style>
  body { margin:0; padding:0; }
  #map { position:absolute; top:0; bottom:0; width:100%; }
</style>
<script>
	var demoAccessToken = 'pk.eyJ1IjoibWFwYm94IiwiYSI6ImNpejh2N21nMzAxMmQzMnA5emRyN2lucW0ifQ.jSE-g2vsn48Ry928pqylcg' || 'pk.eyJ1IjoibWFwYm94IiwiYSI6ImNpejY4M29iazA2Z2gycXA4N2pmbDZmangifQ.-g_vE53SD2WrJ6tFX7QHmA';
</script>
</head>
<body>
<div id='map'></div>

<script>
L.mapbox.accessToken = '<your access token here>';
L.mapbox.accessToken = demoAccessToken;
var map = L.mapbox.map('map', 'mapbox.streets', {
    // Disable default double-click behavior.
    doubleClickZoom: false
})
.setView([46.695, 11.470], 4)
.on('dblclick', function(e) {
    // Zoom exactly to each double-clicked point
    map.setView(e.latlng, map.getZoom() + 1);
});

// L.control.scale() is included in Leaflet see
// https://www.mapbox.com/mapbox.js/api/v3.0.1/l-control-scale/
L.control.scale().addTo(map);
</script>
</body>
</html>
Töltésjelző megjelenítése
<!-- Show loading screen -->
<!-- Use events to show when features are loading and loaded by displaying and hiding a loading message -->

<!DOCTYPE html>
<html>
<head>
<meta charset=utf-8 />
<title>Show loading screen</title>
<meta name='viewport' content='initial-scale=1,maximum-scale=1,user-scalable=no' />
<script src='https://api.mapbox.com/mapbox.js/v3.0.1/mapbox.js'></script>
<link href='https://api.mapbox.com/mapbox.js/v3.0.1/mapbox.css' rel='stylesheet' />
<style>
	body { margin:0; padding:0; }
	#map { position:absolute; top:0; bottom:0; width:100%; }
</style>
<script>
var demoAccessToken = 'pk.eyJ1IjoibWFwYm94IiwiYSI6ImNpejh2N21nMzAxMmQzMnA5emRyN2lucW0ifQ.jSE-g2vsn48Ry928pqylcg' || 'pk.eyJ1IjoibWFwYm94IiwiYSI6ImNpejY4M29iazA2Z2gycXA4N2pmbDZmangifQ.-g_vE53SD2WrJ6tFX7QHmA';
</script>
</head>
<body>
<style>

/*
 * This is a very simple version of a 'loading screen': there are much
 * fancier ones you can use instead, like
 * http://codepen.io/collection/HtAne/
 */
#loader {
    position:absolute; top:0; bottom:0; width:100%;
    background:rgba(255, 255, 255, 1);
    transition:background 1s ease-out;
    -webkit-transition:background 1s ease-out;
}
#loader.done {
    background:rgba(255, 255, 255, 0);
}
#loader.hide {
    display:none;
}
#loader .message {
    position:absolute;
    left:50%;
    top:50%;
}
</style>
<div id='map'></div>
<div id='loader'><span class='message'>loading</span></div>
<script>
L.mapbox.accessToken = '<your access token here>';
L.mapbox.accessToken = demoAccessToken;
var loader = document.getElementById('loader');

var map = L.mapbox.map('map')
    .setView([47.47, 19.06], 13);

// Add a tile layer with a loading animation

// start the loading screen
startLoading();
L.mapbox.tileLayer('mapbox.streets')
    .addTo(map) // add your tiles to the map
    .on('load', finishedLoading); // when the tiles load, remove the screen

function startLoading() {
    loader.className = '';
}

function finishedLoading() {
    // first, toggle the class 'done', which makes the loading screen
    // fade out
    loader.className = 'done';
    setTimeout(function() {
        // then, after a half-second, add the class 'hide', which hides
        // it completely and ensures that the user can interact with the
        // map again.
        loader.className = 'hide';
    }, 500);
}
</script>
</body>
</html>
Jelölők a térképen
Egyszerű jelölő ikonnal
<!-- Marker without GeoJSON -->
<!-- Use L.mapbox.marker.icon to create a simple marker without GeoJSON. -->
<!-- Icon examples: https://www.mapbox.com/maki-icons/ -->

<!DOCTYPE html>
<html>
<head>
<meta charset=utf-8 />
<title>Marker without GeoJSON</title>
<meta name='viewport' content='initial-scale=1,maximum-scale=1,user-scalable=no' />
<script src='https://api.mapbox.com/mapbox.js/v3.0.1/mapbox.js'></script>
<link href='https://api.mapbox.com/mapbox.js/v3.0.1/mapbox.css' rel='stylesheet' />
<style>
  body { margin:0; padding:0; }
  #map { position:absolute; top:0; bottom:0; width:100%; }
</style>
<script>
var demoAccessToken = 'pk.eyJ1IjoibWFwYm94IiwiYSI6ImNpejh2N21nMzAxMmQzMnA5emRyN2lucW0ifQ.jSE-g2vsn48Ry928pqylcg' || 'pk.eyJ1IjoibWFwYm94IiwiYSI6ImNpejY4M29iazA2Z2gycXA4N2pmbDZmangifQ.-g_vE53SD2WrJ6tFX7QHmA';
</script>
</head>
<body>
<div id='map'></div>

<script>
L.mapbox.accessToken = '<your access token here>';
L.mapbox.accessToken = demoAccessToken;
var map = L.mapbox.map('map', 'mapbox.streets')
    .setView([47.47, 19.06], 16);

// L.marker is a low-level marker constructor in Leaflet.
L.marker([47.47, 19.06], {
    icon: L.mapbox.marker.icon({
        'marker-size': 'large',
        'marker-symbol': 'roadblock',
        'marker-color': '#fa0'
    })
}).addTo(map);
L.marker([47.4725, 19.0625], {
    icon: L.mapbox.marker.icon({
        'marker-size': 'large',
        'marker-symbol': 'college',
        'marker-color': '64BA49'
    })
}).addTo(map);
</script>
</body>
</html>
Jelölő koordinátáinak megjelenítése
Display latitude and longitude on marker movement
<!-- Display latitude and longitude on marker movement -->
<!-- Drag the marker to a new location on a map to view it's coordinates. -->

<!DOCTYPE html>
<html>
<head>
<meta charset=utf-8 />
<title>Display latitude and longitude on marker movement</title>
<meta name='viewport' content='initial-scale=1,maximum-scale=1,user-scalable=no' />
<script src='https://api.mapbox.com/mapbox.js/v3.0.1/mapbox.js'></script>
<link href='https://api.mapbox.com/mapbox.js/v3.0.1/mapbox.css' rel='stylesheet' />
<style>
  body { margin:0; padding:0; }
  #map { position:absolute; top:0; bottom:0; width:100%; }
</style>
<script>
var demoAccessToken = 'pk.eyJ1IjoibWFwYm94IiwiYSI6ImNpejh2N21nMzAxMmQzMnA5emRyN2lucW0ifQ.jSE-g2vsn48Ry928pqylcg' || 'pk.eyJ1IjoibWFwYm94IiwiYSI6ImNpejY4M29iazA2Z2gycXA4N2pmbDZmangifQ.-g_vE53SD2WrJ6tFX7QHmA';
</script>
</head>
<body>
<style>
pre.ui-coordinates {
  position:absolute;
  bottom:10px;
  left:10px;
  padding:5px 10px;
  background:rgba(0,0,0,0.5);
  color:#fff;
  font-size:11px;
  line-height:18px;
  border-radius:3px;
  }
</style>
<div id='map'></div>
<pre id='coordinates' class='ui-coordinates'></pre>
<script>
L.mapbox.accessToken = '<your access token here>';
L.mapbox.accessToken = demoAccessToken;
var map = L.mapbox.map('map', 'mapbox.streets')
    .setView([0, 0], 3);

var coordinates = document.getElementById('coordinates');

var marker = L.marker([0, 0], {
    icon: L.mapbox.marker.icon({
      'marker-color': '#f86767'
    }),
    draggable: true
}).addTo(map);

// every time the marker is dragged, update the coordinates container
marker.on('dragend', ondragend);

// Set the initial marker coordinate on load.
ondragend();

function ondragend() {
    var m = marker.getLatLng();
    coordinates.innerHTML = 'Latitude: ' + m.lat + '<br />Longitude: ' + m.lng;
}
</script>
</body>
</html>
Jelölőtől való távolság
<!-- Distance between two markers -->
<!-- Calculate the distance between two points in meters using distanceTo. -->

<!DOCTYPE html>
<html>
<head>
<meta charset=utf-8 />
<title>Distance between two markers</title>
<meta name='viewport' content='initial-scale=1,maximum-scale=1,user-scalable=no' />
<script src='https://api.mapbox.com/mapbox.js/v3.0.1/mapbox.js'></script>
<link href='https://api.mapbox.com/mapbox.js/v3.0.1/mapbox.css' rel='stylesheet' />
<style>
  body { margin:0; padding:0; }
  #map { position:absolute; top:0; bottom:0; width:100%; }
</style>
<script>
var demoAccessToken = 'pk.eyJ1IjoibWFwYm94IiwiYSI6ImNpejh2N21nMzAxMmQzMnA5emRyN2lucW0ifQ.jSE-g2vsn48Ry928pqylcg' || 'pk.eyJ1IjoibWFwYm94IiwiYSI6ImNpejY4M29iazA2Z2gycXA4N2pmbDZmangifQ.-g_vE53SD2WrJ6tFX7QHmA';
</script>
</head>
<body>
<style>
pre.ui-distance {
  position:absolute;
  bottom:10px;
  left:10px;
  padding:5px 10px;
  background:rgba(0,0,0,0.5);
  color:#fff;
  font-size:11px;
  line-height:18px;
  border-radius:3px;
  }
</style>
<div id='map'></div>
<pre id='distance' class='ui-distance'>Click to place a marker</pre>

<script>
L.mapbox.accessToken = '<your access token here>';
L.mapbox.accessToken = demoAccessToken;
var map = L.mapbox.map('map', 'mapbox.streets')
    .setView([47.47, 19.06], 15);

// Start with a fixed marker.
var fixedMarker = L.marker(new L.LatLng(47.4725, 19.0625), {
    icon: L.mapbox.marker.icon({
        'marker-color': 'ff8888'
    })
}).bindPopup('ELTE Déli tömb').addTo(map);

// Store the fixedMarker coordinates in a variable.
var fc = fixedMarker.getLatLng();

// Create a featureLayer that will hold a marker and linestring.
var featureLayer = L.mapbox.featureLayer().addTo(map);

// When a user clicks on the map we want to
// create a new L.featureGroup that will contain a
// marker placed where the user selected the map and
// a linestring that draws itself between the fixedMarkers
// coordinates and the newly placed marker.
map.on('click', function(ev) {
    // ev.latlng gives us the coordinates of
    // the spot clicked on the map.
    var c = ev.latlng;

    var geojson = {
      type: 'FeatureCollection',
      features: [
        {
          "type": "Feature",
          "geometry": {
            "type": "Point",
            "coordinates": [c.lng, c.lat]
          },
          "properties": {
            "marker-color": "#ff8888"
          }
        }, {
          "type": "Feature",
          "geometry": {
            "type": "LineString",
            "coordinates": [
              [fc.lng, fc.lat],
              [c.lng, c.lat]
            ]
          },
          "properties": {
            "stroke": "#000",
            "stroke-opacity": 0.5,
            "stroke-width": 4
          }
        }
      ]
    };

    featureLayer.setGeoJSON(geojson);

    // Finally, print the distance between these two points
    // on the screen using distanceTo().
    var container = document.getElementById('distance');
    container.innerHTML = (fc.distanceTo(c)).toFixed(0) + 'm';
});
</script>
</body>
</html>
Marker navigation from a marker menu
<!-- Marker navigation from a marker menu -->
<!-- Zoom to a marker and open its tooltip when a marker menu in a list is selected. -->
<!DOCTYPE html>
<html>
<head>
<meta charset=utf-8 />
<title>Marker navigation from a marker menu</title>
<meta name='viewport' content='initial-scale=1,maximum-scale=1,user-scalable=no' />
<script src='https://api.mapbox.com/mapbox.js/v3.0.1/mapbox.js'></script>
<link href='https://api.mapbox.com/mapbox.js/v3.0.1/mapbox.css' rel='stylesheet' />
<style>
  body { margin:0; padding:0; }
  #map { position:absolute; top:0; bottom:0; width:100%; }
</style>
<script>
var demoAccessToken = 'pk.eyJ1IjoibWFwYm94IiwiYSI6ImNpejh2N21nMzAxMmQzMnA5emRyN2lucW0ifQ.jSE-g2vsn48Ry928pqylcg' || 'pk.eyJ1IjoibWFwYm94IiwiYSI6ImNpejY4M29iazA2Z2gycXA4N2pmbDZmangifQ.-g_vE53SD2WrJ6tFX7QHmA';
</script>
</head>
<body>
<style>
  .info {
    background:#fff;
    position:absolute;
    width:260px;
    top:10px;
    right:10px;
    border-radius:2px;
    }
    .info .item {
      display:block;
      border-bottom:1px solid #eee;
      padding:10px;
      text-decoration:none;
      }
      .info .item small { color:#888; }
      .info .item:hover,
      .info .item.active { background:#f8f8f8; }
      .info .item:last-child { border-bottom:none; }
</style>

<div id='map' class='map'></div>
<div id='info' class='info'></div>

<script>
L.mapbox.accessToken = '<your access token here>';
L.mapbox.accessToken = demoAccessToken;
var map = L.mapbox.map('map', 'mapbox.streets').setView([47.47, 19.06], 15);

var myLayer = L.mapbox.featureLayer().addTo(map);

myLayer.setGeoJSON({
  type: 'FeatureCollection',
  features: [
    {
      type: 'Feature',
      geometry: {
          type: 'Point',
          coordinates: [19.0625, 47.4725]
      },
      properties: {
          title: 'ELTE Déli tömb',
          description: 'ELTE IK',
          'marker-id': 'marker-1',
          'marker-color': '#f86767'
      }
    },
    {
          type: 'Feature',
          geometry: {
              type: 'Point',
              coordinates: [19.0625, 47.4745]
          },
          properties: {
              title: 'ELTE Északi tömb',
              description: 'ELTE TTK',
              'marker-id': 'marker-2',
              'marker-color': '#f86767'
          }
      },
		{
		  type: 'Feature',
		  geometry: {
			  type: 'Point',
			  coordinates: [19.063425, 47.505258]
		  },
		  properties: {
			  title: 'Oktogon',
			  description: 'Oktogon metró állomás',
			  'marker-id': 'marker-2',
			  'marker-color': '#f86767',
			  'marker-symbol': 'rail-metro'
		  }
		}
  ]
});

var info = document.getElementById('info');

// Iterate through each feature layer item, build a
// marker menu item and enable a click event that pans to + opens
// a marker that's associated to the marker item.
myLayer.eachLayer(function(marker) {
  var link = info.appendChild(document.createElement('a'));
  link.className = 'item';
  link.href = '#';

  // Populate content from each markers object.
  link.innerHTML = marker.feature.properties.title +
    '<br /><small>' + marker.feature.properties.description + '</small>';
  link.onclick = function() {
    if (/active/.test(this.className)) {
      this.className = this.className.replace(/active/, '').replace(/\s\s*$/, '');
    } else {
      var siblings = info.getElementsByTagName('a');
      for (var i = 0; i < siblings.length; i++) {
        siblings[i].className = siblings[i].className
          .replace(/active/, '').replace(/\s\s*$/, '');
      };
      this.className += ' active';

      // When a menu item is clicked, animate the map to center
      // its associated marker and open its popup.
      map.panTo(marker.getLatLng());
      marker.openPopup();
    }
    return false;
  };
});
</script>
</body>
</html>
Csak a környező jelölők megjelenítése
<!-- Marker radius search -->
<!-- Use the .distanceTo function to only show markers within a range -->

<!DOCTYPE html>
<html>
<head>
<meta charset=utf-8 />
<title>Marker radius search</title>
<meta name='viewport' content='initial-scale=1,maximum-scale=1,user-scalable=no' />
<script src='https://api.mapbox.com/mapbox.js/v3.0.1/mapbox.js'></script>
<link href='https://api.mapbox.com/mapbox.js/v3.0.1/mapbox.css' rel='stylesheet' />
<style>
  body { margin:0; padding:0; }
  #map { position:absolute; top:0; bottom:0; width:100%; }
</style>
<script>
var demoAccessToken = 'pk.eyJ1IjoibWFwYm94IiwiYSI6ImNpejh2N21nMzAxMmQzMnA5emRyN2lucW0ifQ.jSE-g2vsn48Ry928pqylcg' || 'pk.eyJ1IjoibWFwYm94IiwiYSI6ImNpejY4M29iazA2Z2gycXA4N2pmbDZmangifQ.-g_vE53SD2WrJ6tFX7QHmA';
</script>
</head>
<body>
<script src='https://api.mapbox.com/mapbox.js/plugins/leaflet-omnivore/v0.2.0/leaflet-omnivore.min.js'></script>
<div id='map'></div>

<script>
L.mapbox.accessToken = '<your access token here>';
L.mapbox.accessToken = demoAccessToken;
var map = L.mapbox.map('map', 'mapbox.emerald')
    .setView([40, -95], 4);

var RADIUS = 500000;
var filterCircle = L.circle(L.latLng(40, -75), RADIUS, {
    opacity: 1,
    weight: 1,
    fillOpacity: 0.4
}).addTo(map);

var csvLayer = omnivore.csv('./data/airports.csv', null, L.mapbox.featureLayer())
    .addTo(map);

map.on('mousemove', function(e) {
    filterCircle.setLatLng(e.latlng);
    csvLayer.setFilter(function showAirport(feature) {
        return e.latlng.distanceTo(L.latLng(
                feature.geometry.coordinates[1],
                feature.geometry.coordinates[0])) < RADIUS;
    });
});
</script>
</body>
</html>
Jelölő mozgatása programozottan
<!-- Marker movement -->
<!-- Simple marker animation. -->

<!DOCTYPE html>
<html>
<head>
<meta charset=utf-8 />
<title>Marker movement</title>
<meta name='viewport' content='initial-scale=1,maximum-scale=1,user-scalable=no' />
<script src='https://api.mapbox.com/mapbox.js/v3.0.1/mapbox.js'></script>
<link href='https://api.mapbox.com/mapbox.js/v3.0.1/mapbox.css' rel='stylesheet' />
<style>
  body { margin:0; padding:0; }
  #map { position:absolute; top:0; bottom:0; width:100%; }
</style>
<script>
var demoAccessToken = 'pk.eyJ1IjoibWFwYm94IiwiYSI6ImNpejh2N21nMzAxMmQzMnA5emRyN2lucW0ifQ.jSE-g2vsn48Ry928pqylcg' || 'pk.eyJ1IjoibWFwYm94IiwiYSI6ImNpejY4M29iazA2Z2gycXA4N2pmbDZmangifQ.-g_vE53SD2WrJ6tFX7QHmA';
</script>
</head>
<body>
<div id='map'></div>

<script>
L.mapbox.accessToken = '<your access token here>';
L.mapbox.accessToken = demoAccessToken;
var map = L.mapbox.map('map', 'mapbox.light')
  .setView([0, 0], 3);

var marker = L.marker([0, 0], {
    icon: L.mapbox.marker.icon({
      'marker-color': '#f86767'
    })
});

var t = 0;
window.setInterval(function() {
    // Making a lissajous curve just for fun.
    // Create your own animated path here.
    marker.setLatLng(L.latLng(
        Math.cos(t * 0.5) * 10,
        Math.sin(t) * 10));
    t += 0.01; // Movement
}, 1); // Speed

marker.addTo(map);
</script>
</body>
</html>
Jelölő animálása geoJson vonalon
<!-- Animate a marker along line -->
<!-- Create a marker and animate its position along the length of a line by looking up its coordinates. -->

<!DOCTYPE html>
<html>
<head>
<meta charset=utf-8 />
<title>Animate a marker along line</title>
<meta name='viewport' content='initial-scale=1,maximum-scale=1,user-scalable=no' />
<script src='https://api.mapbox.com/mapbox.js/v3.0.1/mapbox.js'></script>
<link href='https://api.mapbox.com/mapbox.js/v3.0.1/mapbox.css' rel='stylesheet' />
<style>
  body { margin:0; padding:0; }
  #map { position:absolute; top:0; bottom:0; width:100%; }
</style>
<script>
var demoAccessToken = 'pk.eyJ1IjoibWFwYm94IiwiYSI6ImNpejh2N21nMzAxMmQzMnA5emRyN2lucW0ifQ.jSE-g2vsn48Ry928pqylcg' || 'pk.eyJ1IjoibWFwYm94IiwiYSI6ImNpejY4M29iazA2Z2gycXA4N2pmbDZmangifQ.-g_vE53SD2WrJ6tFX7QHmA';
</script>
</head>
<body>
<div id='map'></div>

<script>
L.mapbox.accessToken = '<your access token here>';
L.mapbox.accessToken = demoAccessToken;
var map = L.mapbox.map('map', 'mapbox.streets').setView([0, 0], 3);

// Generate a GeoJSON line. You could also load GeoJSON via AJAX
// or generate it some other way.
var geojson = { type: 'LineString', coordinates: [] };
var start = [0, 0];
var momentum = [2, 2];

for (var i = 0; i < 1000; i++) {
    start[0] += momentum[0];
    start[1] += momentum[1];
    if (start[1] > 30 || start[1] < -30) momentum[1] *= -1;
    if (start[0] > 90 || start[0] < -90) momentum[0] *= -1;
    geojson.coordinates.push(start.slice());
}

// Add this generated geojson object to the map.
L.geoJson(geojson).addTo(map);

// Create a counter with a value of 0.
var j = 0;

// Create a marker and add it to the map.
var marker = L.marker([0, 0], {
  icon: L.mapbox.marker.icon({
    'marker-color': '#f86767'
  })
}).addTo(map);

tick();
function tick() {
    // Set the marker to be at the same point as one
    // of the segments or the line.
    marker.setLatLng(L.latLng(
        geojson.coordinates[j][1],
        geojson.coordinates[j][0]));

    // Move to the next point of the line
    // until `j` reaches the length of the array.
    if (++j < geojson.coordinates.length) setTimeout(tick, 20);
}
</script>
</body>
</html>
Tippek, üzenetek, szövegek
Egyedi jelölő tipp
<!-- Custom marker tooltips -->
<!-- How to create a custom marker tooltip with style text or images using Mapbox.js, our open source JavaScript library. -->

<!DOCTYPE html>
<html>
<head>
<meta charset=utf-8 />
<title>Custom marker tooltips</title>
<meta name='viewport' content='initial-scale=1,maximum-scale=1,user-scalable=no' />
<script src='https://api.mapbox.com/mapbox.js/v3.0.1/mapbox.js'></script>
<link href='https://api.mapbox.com/mapbox.js/v3.0.1/mapbox.css' rel='stylesheet' />
<style>
  body { margin:0; padding:0; }
  #map { position:absolute; top:0; bottom:0; width:100%; }
</style>
<script>
var demoAccessToken = 'pk.eyJ1IjoibWFwYm94IiwiYSI6ImNpejh2N21nMzAxMmQzMnA5emRyN2lucW0ifQ.jSE-g2vsn48Ry928pqylcg' || 'pk.eyJ1IjoibWFwYm94IiwiYSI6ImNpejY4M29iazA2Z2gycXA4N2pmbDZmangifQ.-g_vE53SD2WrJ6tFX7QHmA';
</script>
</head>
<body>
<style>
.leaflet-popup-content img {
  max-width:100%;
  }
</style>
<div id='map'></div>

<script>
L.mapbox.accessToken = '<your access token here>';
L.mapbox.accessToken = demoAccessToken;
var map = L.mapbox.map('map', 'mapbox.streets')
    .setView([47.47, 19.06], 15);

var myLayer = L.mapbox.featureLayer().addTo(map);

var geoJson = [{
    type: 'Feature',
    "geometry": { "type": "Point", "coordinates": [19.06, 47.47]},
    "properties": {
        "image": "http://hazai.kozep.bme.hu/wp-content/uploads/2013/06/00-Info-E-nyit%C3%B3.jpg",
        "url": "http://www.infopark.hu/",
        "marker-symbol": "star",
        "marker-color": "#ff8888",
        "marker-size": "large",
        "city": "Budapest - Infopark"
    }
	},
	{
		type: 'Feature',
		"geometry": { "type": "Point", "coordinates": [19.063, 47.473]},
		"properties": {
			"image": "http://photos.wikimapia.org/p/00/02/45/33/03_big.jpg",
			"url": "https://www.elte.hu/",
			"marker-symbol": "star",
			"marker-color": "#ff8888",
			"marker-size": "large",
			"city": "Budapest - ELTE Lágymányos"
		}
}];

// Add custom popups to each using our custom feature properties
myLayer.on('layeradd', function(e) {
    var marker = e.layer,
        feature = marker.feature;

    // Create custom popup content
    var popupContent =  '<a target="_blank" class="popup" href="' + feature.properties.url + '">' +
                            '<img src="' + feature.properties.image + '" />' +
                            feature.properties.city +
                        '</a>';

    // http://leafletjs.com/reference.html#popup
    marker.bindPopup(popupContent,{
        closeButton: false,
        minWidth: 480
    });
});

// Add features to the map
myLayer.setGeoJSON(geoJson);
</script>
</body>
</html>
Jelölőhöz tartozó tipp megjelenítése egérrel
<!-- Show tooltips on hover -->
<!-- How to show marker popups on hover with Mapbox.js, our open source JavaScript library. -->

<!DOCTYPE html>
<html>
<head>
<meta charset=utf-8 />
<title>Show tooltips on hover</title>
<meta name='viewport' content='initial-scale=1,maximum-scale=1,user-scalable=no' />
<script src='https://api.mapbox.com/mapbox.js/v3.0.1/mapbox.js'></script>
<link href='https://api.mapbox.com/mapbox.js/v3.0.1/mapbox.css' rel='stylesheet' />
<style>
  body { margin:0; padding:0; }
  #map { position:absolute; top:0; bottom:0; width:100%; }
</style>
<script>
var demoAccessToken = 'pk.eyJ1IjoibWFwYm94IiwiYSI6ImNpejh2N21nMzAxMmQzMnA5emRyN2lucW0ifQ.jSE-g2vsn48Ry928pqylcg' || 'pk.eyJ1IjoibWFwYm94IiwiYSI6ImNpejY4M29iazA2Z2gycXA4N2pmbDZmangifQ.-g_vE53SD2WrJ6tFX7QHmA';
</script>
</head>
<body>
<div id='map'></div>

<script>
L.mapbox.accessToken = '<your access token here>';
L.mapbox.accessToken = demoAccessToken;
var map = L.mapbox.map('map', 'mapbox.light')
  .setView([47.47, 19.06], 15);

var myLayer = L.mapbox.featureLayer().addTo(map);

var geojson = {
    type: 'FeatureCollection',
    features: [{
        type: 'Feature',
        properties: {
            title: 'Bal alsó',
            'marker-color': '#f86767',
            'marker-size': 'small',
            'marker-symbol': 'star'
        },
        geometry: {
            type: 'Point',
            coordinates: [19.05, 47.46]
        }
    },
    {
        type: 'Feature',
        properties: {
            title: 'Jobb felső',
            'marker-color': '#7ec9b1',
            'marker-size': 'large',
            'marker-symbol': 'star'
        },
        geometry: {
            type: 'Point',
            coordinates: [19.07, 47.48]
        }
    }]
};

myLayer.setGeoJSON(geojson);
myLayer.on('mouseover', function(e) {
    e.layer.openPopup();
});
myLayer.on('mouseout', function(e) {
    e.layer.closePopup();
});
</script>
</body>
</html>
Helyek
Hely keresése automatikus kiegészítéssel
<!-- Geocoding with autocomplete -->
<!-- Using the Mapbox Geocoding API to show real-time search suggestions. -->

<!DOCTYPE html>
<html>
<head>
<meta charset=utf-8 />
<title>Geocoding with autocomplete</title>
<meta name='viewport' content='initial-scale=1,maximum-scale=1,user-scalable=no' />
<script src='https://api.mapbox.com/mapbox.js/v3.0.1/mapbox.js'></script>
<link href='https://api.mapbox.com/mapbox.js/v3.0.1/mapbox.css' rel='stylesheet' />
<style>
  body { margin:0; padding:0; }
  #map { position:absolute; top:0; bottom:0; width:100%; }
</style>
<script>
var demoAccessToken = 'pk.eyJ1IjoibWFwYm94IiwiYSI6ImNpejh2N21nMzAxMmQzMnA5emRyN2lucW0ifQ.jSE-g2vsn48Ry928pqylcg' || 'pk.eyJ1IjoibWFwYm94IiwiYSI6ImNpejY4M29iazA2Z2gycXA4N2pmbDZmangifQ.-g_vE53SD2WrJ6tFX7QHmA';
</script>
</head>
<body>
<div id='map'></div>
<script>
L.mapbox.accessToken = '<your access token here>';
L.mapbox.accessToken = demoAccessToken;
L.mapbox.map('map', 'mapbox.streets')
    .addControl(L.mapbox.geocoderControl('mapbox.places', {
        autocomplete: true
    }));
</script>
</body>
</html>
Hely lekérdezése név alapján (Geocoderrel)
Use geocoder to set map position
<!-- Use geocoder to set map position -->
<!-- Using the Mapbox Geocoding API initially set map position on Chester, New Jersey. -->

<!DOCTYPE html>
<html>
<head>
<meta charset=utf-8 />
<title>Use geocoder to set map position</title>
<meta name='viewport' content='initial-scale=1,maximum-scale=1,user-scalable=no' />
<script src='https://api.mapbox.com/mapbox.js/v3.0.1/mapbox.js'></script>
<link href='https://api.mapbox.com/mapbox.js/v3.0.1/mapbox.css' rel='stylesheet' />
<style>
  body { margin:0; padding:0; }
  #map { position:absolute; top:0; bottom:0; width:100%; }
</style>
<script>
var demoAccessToken = 'pk.eyJ1IjoibWFwYm94IiwiYSI6ImNpejh2N21nMzAxMmQzMnA5emRyN2lucW0ifQ.jSE-g2vsn48Ry928pqylcg' || 'pk.eyJ1IjoibWFwYm94IiwiYSI6ImNpejY4M29iazA2Z2gycXA4N2pmbDZmangifQ.-g_vE53SD2WrJ6tFX7QHmA';
</script>
</head>
<body>
<div id='map'></div>
<script>
L.mapbox.accessToken = '<your access token here>';
L.mapbox.accessToken = demoAccessToken;
var geocoder = L.mapbox.geocoder('mapbox.places'),
    map = L.mapbox.map('map', 'examples.map-h67hf2ic');

geocoder.query('Tab, HU', showMap);

function showMap(err, data) {
    // The geocoder can return an area, like a city, or a
    // point, like an address. Here we handle both cases,
    // by fitting the map bounds to an area or zooming to a point.
    if (data.lbounds) {
        map.fitBounds(data.lbounds);
    } else if (data.latlng) {
        map.setView([data.latlng[0], data.latlng[1]], 13);
    }
}
</script>
</body>
</html>
Aktuális pozíció megjelenítése (megközelítőleg)
FONTOS: A Geolocation, azaz helymeghatározás használatához valid HTTPS kapcsolat szükséges.
<!-- Geolocation -->
<!-- Finding the user's position -->

<!DOCTYPE html>
<html>
<head>
<meta charset=utf-8 />
<title>Geolocation</title>
<meta name='viewport' content='initial-scale=1,maximum-scale=1,user-scalable=no' />
<script src='https://api.mapbox.com/mapbox.js/v3.0.1/mapbox.js'></script>
<link href='https://api.mapbox.com/mapbox.js/v3.0.1/mapbox.css' rel='stylesheet' />
<style>
  body { margin:0; padding:0; }
  #map { position:absolute; top:0; bottom:0; width:100%; }
</style>
<script>
var demoAccessToken = 'pk.eyJ1IjoibWFwYm94IiwiYSI6ImNpejh2N21nMzAxMmQzMnA5emRyN2lucW0ifQ.jSE-g2vsn48Ry928pqylcg' || 'pk.eyJ1IjoibWFwYm94IiwiYSI6ImNpejY4M29iazA2Z2gycXA4N2pmbDZmangifQ.-g_vE53SD2WrJ6tFX7QHmA';
</script>
</head>
<body>
<style>
.ui-button {
  background:#3887BE;
  color:#FFF;
  display:block;
  position:absolute;
  top:50%;left:50%;
  width:160px;
  margin:-20px 0 0 -80px;
  z-index:100;
  text-align:center;
  padding:10px;
  border:1px solid rgba(0,0,0,0.4);
  border-radius:3px;
  }
  .ui-button:hover {
    background:#3074a4;
    color:#fff;
    }
</style>

<div id='map'></div>
<a href='#' id='geolocate' class='ui-button'>Find me</a>

<script>
L.mapbox.accessToken = '<your access token here>';
L.mapbox.accessToken = demoAccessToken;
var geolocate = document.getElementById('geolocate');
var map = L.mapbox.map('map', 'mapbox.streets');

var myLayer = L.mapbox.featureLayer().addTo(map);

// This uses the HTML5 geolocation API, which is available on
// most mobile browsers and modern browsers, but not in Internet Explorer
//
// See this chart of compatibility for details:
// http://caniuse.com/#feat=geolocation
if (!navigator.geolocation) {
    geolocate.innerHTML = 'Geolocation is not available';
} else {
    geolocate.onclick = function (e) {
        e.preventDefault();
        e.stopPropagation();
        map.locate();
    };
}

// Once we've got a position, zoom and center the map
// on it, and add a single marker.
map.on('locationfound', function(e) {
    map.fitBounds(e.bounds);

    myLayer.setGeoJSON({
        type: 'Feature',
        geometry: {
            type: 'Point',
            coordinates: [e.latlng.lng, e.latlng.lat]
        },
        properties: {
            'title': 'Here I am!',
            'marker-color': '#ff8888',
            'marker-symbol': 'star'
        }
    });

    // And hide the geolocation button
    geolocate.parentNode.removeChild(geolocate);
});

// If the user chooses not to allow their location
// to be shared, display an error message.
map.on('locationerror', function() {
    geolocate.innerHTML = 'Position could not be found';
});
</script>
</body>
</html>
Útvonaltervezés (Autós, biciklis, gyalogos közlekedéssel)
<!-- Directions -->
<!-- Use the mapbox-directions.js plugin to show results from the Mapbox Directions API -->

<html>
<head>
<meta charset=utf-8 />
<title>Directions</title>
<meta name='viewport' content='initial-scale=1,maximum-scale=1,user-scalable=no' />
<script src='https://api.mapbox.com/mapbox.js/v3.0.1/mapbox.js'></script>
<link href='https://api.mapbox.com/mapbox.js/v3.0.1/mapbox.css' rel='stylesheet' />
<style>
  body { margin:0; padding:0; }
  #map { position:absolute; top:0; bottom:0; width:100%; }
</style>
<script>
var demoAccessToken = 'pk.eyJ1IjoibWFwYm94IiwiYSI6ImNpejh2N21nMzAxMmQzMnA5emRyN2lucW0ifQ.jSE-g2vsn48Ry928pqylcg' || 'pk.eyJ1IjoibWFwYm94IiwiYSI6ImNpejY4M29iazA2Z2gycXA4N2pmbDZmangifQ.-g_vE53SD2WrJ6tFX7QHmA';
</script>
</head>
<body>
<style>
#inputs,
#errors,
#directions {
    position: absolute;
    width: 33.3333%;
    max-width: 300px;
    min-width: 200px;
}

#inputs {
    z-index: 10;
    top: 10px;
    left: 10px;
}

#directions {
    z-index: 99;
    background: rgba(0,0,0,.8);
    top: 0;
    right: 0;
    bottom: 0;
    overflow: auto;
}

#errors {
    z-index: 8;
    opacity: 0;
    padding: 10px;
    border-radius: 0 0 3px 3px;
    background: rgba(0,0,0,.25);
    top: 90px;
    left: 10px;
}

</style>

<script src='https://api.mapbox.com/mapbox.js/plugins/mapbox-directions.js/v0.4.0/mapbox.directions.js'></script>
<link rel='stylesheet' href='https://api.mapbox.com/mapbox.js/plugins/mapbox-directions.js/v0.4.0/mapbox.directions.css' type='text/css' />

<div id='map'></div>
<div id='inputs'></div>
<div id='errors'></div>
<div id='directions'>
  <div id='routes'></div>
  <div id='instructions'></div>
</div>
<script>
L.mapbox.accessToken = '<your access token here>';
L.mapbox.accessToken = demoAccessToken;
var map = L.mapbox.map('map', 'mapbox.streets', {
    zoomControl: false
}).setView([47.47, 19.06], 15);

// move the attribution control out of the way
map.attributionControl.setPosition('bottomleft');

// create the initial directions object, from which the layer
// and inputs will pull data.
var directions = L.mapbox.directions();

var directionsLayer = L.mapbox.directions.layer(directions)
    .addTo(map);

var directionsInputControl = L.mapbox.directions.inputControl('inputs', directions)
    .addTo(map);

var directionsErrorsControl = L.mapbox.directions.errorsControl('errors', directions)
    .addTo(map);

var directionsRoutesControl = L.mapbox.directions.routesControl('routes', directions)
    .addTo(map);

var directionsInstructionsControl = L.mapbox.directions.instructionsControl('instructions', directions)
    .addTo(map);
</script>
</body>
</html>
Plugin támogatás és a Mapbox
Leaflet-MiniMap
<!-- Leaflet-MiniMap -->
<!-- Display a smaller navigable map using the Leaflet-MiniMap plugin. -->

<!DOCTYPE html>
<html>
<head>
<meta charset=utf-8 />
<title>Leaflet-MiniMap</title>
<meta name='viewport' content='initial-scale=1,maximum-scale=1,user-scalable=no' />
<script src='https://api.mapbox.com/mapbox.js/v3.0.1/mapbox.js'></script>
<link href='https://api.mapbox.com/mapbox.js/v3.0.1/mapbox.css' rel='stylesheet' />
<style>
  body { margin:0; padding:0; }
  #map { position:absolute; top:0; bottom:0; width:100%; }
</style>
<script>
var demoAccessToken = 'pk.eyJ1IjoibWFwYm94IiwiYSI6ImNpejh2N21nMzAxMmQzMnA5emRyN2lucW0ifQ.jSE-g2vsn48Ry928pqylcg' || 'pk.eyJ1IjoibWFwYm94IiwiYSI6ImNpejY4M29iazA2Z2gycXA4N2pmbDZmangifQ.-g_vE53SD2WrJ6tFX7QHmA';
</script>
</head>
<body>
<script src='https://api.mapbox.com/mapbox.js/plugins/leaflet-minimap/v1.0.0/Control.MiniMap.js'></script>
<link href='https://api.mapbox.com/mapbox.js/plugins/leaflet-minimap/v1.0.0/Control.MiniMap.css' rel='stylesheet' />

<div id='map'></div>

<script>
L.mapbox.accessToken = '<your access token here>';
L.mapbox.accessToken = demoAccessToken;
var map = L.mapbox.map('map', 'mapbox.streets')
    .on('ready', function() {
        new L.Control.MiniMap(L.mapbox.tileLayer('mapbox.streets'))
            .addTo(map);
    });
</script>
</body>
</html>
Leaflet Fullscreen
<!-- Leaflet Fullscreen -->
<!-- Add a control to enable a map to be in full screen mode. -->

<!DOCTYPE html>
<html>
<head>
<meta charset=utf-8 />
<title>Leaflet Fullscreen</title>
<meta name='viewport' content='initial-scale=1,maximum-scale=1,user-scalable=no' />
<script src='https://api.mapbox.com/mapbox.js/v3.0.1/mapbox.js'></script>
<link href='https://api.mapbox.com/mapbox.js/v3.0.1/mapbox.css' rel='stylesheet' />
<style>
  body { margin:0; padding:0; }
  #map { position:absolute; top:0; bottom:0; width:100%; }
</style>
<script>
var demoAccessToken = 'pk.eyJ1IjoibWFwYm94IiwiYSI6ImNpejh2N21nMzAxMmQzMnA5emRyN2lucW0ifQ.jSE-g2vsn48Ry928pqylcg' || 'pk.eyJ1IjoibWFwYm94IiwiYSI6ImNpejY4M29iazA2Z2gycXA4N2pmbDZmangifQ.-g_vE53SD2WrJ6tFX7QHmA';
</script>
</head>
<body>
<script src='https://api.mapbox.com/mapbox.js/plugins/leaflet-fullscreen/v1.0.1/Leaflet.fullscreen.min.js'></script>
<link href='https://api.mapbox.com/mapbox.js/plugins/leaflet-fullscreen/v1.0.1/leaflet.fullscreen.css' rel='stylesheet' />

<div id='map'></div>

<script>
L.mapbox.accessToken = '<your access token here>';
L.mapbox.accessToken = demoAccessToken;
var map = L.mapbox.map('map', 'mapbox.streets')
    .setView([47.47, 19.06], 15);

L.control.fullscreen().addTo(map);
</script>
</body>
</html>
Leaflet Heat
<!-- Leaflet Heat -->
<!-- Initially draw heatmap data on a map and allow a users mouse movement to draw their own. -->

<!DOCTYPE html>
<html>
<head>
<meta charset=utf-8 />
<title>Leaflet Heat</title>
<meta name='viewport' content='initial-scale=1,maximum-scale=1,user-scalable=no' />
<script src='https://api.mapbox.com/mapbox.js/v3.0.1/mapbox.js'></script>
<link href='https://api.mapbox.com/mapbox.js/v3.0.1/mapbox.css' rel='stylesheet' />
<style>
  body { margin:0; padding:0; }
  #map { position:absolute; top:0; bottom:0; width:100%; }
</style>
<script>
var demoAccessToken = 'pk.eyJ1IjoibWFwYm94IiwiYSI6ImNpejh2N21nMzAxMmQzMnA5emRyN2lucW0ifQ.jSE-g2vsn48Ry928pqylcg' || 'pk.eyJ1IjoibWFwYm94IiwiYSI6ImNpejY4M29iazA2Z2gycXA4N2pmbDZmangifQ.-g_vE53SD2WrJ6tFX7QHmA';
</script>
</head>
<body>
<script src='https://api.mapbox.com/mapbox.js/plugins/leaflet-heat/v0.1.3/leaflet-heat.js'></script>
<div id='map'></div>

<!-- Example data. (near Hamilton, New Zealand)-->
<script src='./data/realworld.388.js'></script>

<script>
L.mapbox.accessToken = '<your access token here>';
L.mapbox.accessToken = demoAccessToken;
    var map = L.mapbox.map('map', 'mapbox.dark')
        .setView([47.47, 19.06], 15);

    var heat = L.heatLayer(addressPoints, {maxZoom: 18}).addTo(map);
    var draw = false;

    // add points on mouse move (except when interacting with the map)
    map.on({
        click:   function () { draw = !draw; },
        mousemove: function (e) {
            if (draw) {
                heat.addLatLng(e.latlng);
            }
        }
    })
</script>
</body>
</html>
Leaflet Markercluster
<!-- Leaflet Markercluster -->
<!-- Using the Leaflet Markercluster plugin -->

<!DOCTYPE html>
<html>
<head>
<meta charset=utf-8 />
<title>Leaflet Markercluster</title>
<meta name='viewport' content='initial-scale=1,maximum-scale=1,user-scalable=no' />
<script src='https://api.mapbox.com/mapbox.js/v3.0.1/mapbox.js'></script>
<link href='https://api.mapbox.com/mapbox.js/v3.0.1/mapbox.css' rel='stylesheet' />
<style>
  body { margin:0; padding:0; }
  #map { position:absolute; top:0; bottom:0; width:100%; }
</style>
<script>
var demoAccessToken = 'pk.eyJ1IjoibWFwYm94IiwiYSI6ImNpejh2N21nMzAxMmQzMnA5emRyN2lucW0ifQ.jSE-g2vsn48Ry928pqylcg' || 'pk.eyJ1IjoibWFwYm94IiwiYSI6ImNpejY4M29iazA2Z2gycXA4N2pmbDZmangifQ.-g_vE53SD2WrJ6tFX7QHmA';
</script>
</head>
<body>
<script src='https://api.mapbox.com/mapbox.js/plugins/leaflet-markercluster/v1.0.0/leaflet.markercluster.js'></script>
<link href='https://api.mapbox.com/mapbox.js/plugins/leaflet-markercluster/v1.0.0/MarkerCluster.css' rel='stylesheet' />
<link href='https://api.mapbox.com/mapbox.js/plugins/leaflet-markercluster/v1.0.0/MarkerCluster.Default.css' rel='stylesheet' />

<!-- Example data. (near Hamilton, New Zealand)-->
<script src="./data/realworld.388.js"></script>

<div id='map'></div>

<script>
L.mapbox.accessToken = '<your access token here>';
L.mapbox.accessToken = demoAccessToken;
    var map = L.mapbox.map('map', 'mapbox.streets')
        .setView([-37.82, 175.215], 14);

    var markers = new L.MarkerClusterGroup();

    for (var i = 0; i < addressPoints.length; i++) {
        var a = addressPoints[i];
        var title = a[2];
        var marker = L.marker(new L.LatLng(a[0], a[1]), {
            icon: L.mapbox.marker.icon({'marker-symbol': 'post', 'marker-color': '0044FF'}),
            title: title
        });
        marker.bindPopup(title);
        markers.addLayer(marker);
    }

    map.addLayer(markers);
</script>
</body>
</html>
Listing markers in clusters
<!-- Listing markers in clusters -->
<!-- Show a list of clustered markers by their coordinates on a map with Mapbox.js. -->

<!DOCTYPE html>
<html>
<head>
<meta charset=utf-8 />
<title>Listing markers in clusters</title>
<meta name='viewport' content='initial-scale=1,maximum-scale=1,user-scalable=no' />
<script src='https://api.mapbox.com/mapbox.js/v3.0.1/mapbox.js'></script>
<link href='https://api.mapbox.com/mapbox.js/v3.0.1/mapbox.css' rel='stylesheet' />
<style>
  body { margin:0; padding:0; }
  #map { position:absolute; top:0; bottom:0; width:100%; }
</style>
<script>
var demoAccessToken = 'pk.eyJ1IjoibWFwYm94IiwiYSI6ImNpejh2N21nMzAxMmQzMnA5emRyN2lucW0ifQ.jSE-g2vsn48Ry928pqylcg' || 'pk.eyJ1IjoibWFwYm94IiwiYSI6ImNpejY4M29iazA2Z2gycXA4N2pmbDZmangifQ.-g_vE53SD2WrJ6tFX7QHmA';
</script>
</head>
<body>
<script src='https://api.mapbox.com/mapbox.js/plugins/leaflet-markercluster/v1.0.0/leaflet.markercluster.js'></script>
<link href='https://api.mapbox.com/mapbox.js/plugins/leaflet-markercluster/v1.0.0/MarkerCluster.css' rel='stylesheet' />
<link href='https://api.mapbox.com/mapbox.js/plugins/leaflet-markercluster/v1.0.0/MarkerCluster.Default.css' rel='stylesheet' />

<style>
pre.ui-coordinates {
  background:rgba(0,0,0,0.5);
  position:absolute;
  bottom:10px;
  left:10px;
  padding:5px 10px;
  color:#fff;
  font-size:11px;
  line-height:18px;
  border-radius:3px;
  max-height:240px;
  overflow:auto;
  width:100px;
  }
</style>

<div id='map'></div>
<pre id='coordinates' class='ui-coordinates'></pre>

<!-- Example data. (near Hamilton, New Zealand)-->
<script src="./data/realworld.388.js"></script>
<script>
L.mapbox.accessToken = '<your access token here>';
L.mapbox.accessToken = demoAccessToken;
var map = L.mapbox.map('map', 'mapbox.streets')
    .setView([-37.82, 175.215], 14);;

var markers = new L.MarkerClusterGroup();

for (var i = 0; i < addressPoints.length; i++) {
    var a = addressPoints[i];
    var title = a[2];
    var marker = L.marker(new L.LatLng(a[0], a[1]), {
        icon: L.mapbox.marker.icon({'marker-symbol': 'post', 'marker-color': '0044FF'}),
        title: title
    });
    marker.bindPopup(title);
    markers.addLayer(marker);
}

map.addLayer(markers);

function onmove() {
    // Get the map bounds - the top-left and bottom-right locations.
    var inBounds = [],
        bounds = map.getBounds();
    markers.eachLayer(function(marker) {
        // For each marker, consider whether it is currently visible by comparing
        // with the current map bounds.
        if (bounds.contains(marker.getLatLng())) {
            inBounds.push(marker.options.title);
        }
    });
    // Display a list of markers.
    document.getElementById('coordinates').innerHTML = inBounds.join('\n');
}

map.on('move', onmove);

// call onmove off the bat so that the list is populated.
// otherwise, there will be no markers listed until the map is moved.
onmove();
</script>
</body>
</html>
Az újabb irányvonal: a Mapbox GL JS megvalósítása és működése a háttérben
Három alapvető működési egység és feladatkör különíthető el a Mapbox működésében. Ezek a következők:
- térkép
- adat
- elemzés
Térkép: Mapbox GL a rendereléshez
A térkép megjelenítését a GPU végzi Mapbox GL segítségével. A legfontosabb jellemzői:
- A régi raszteres adatokkal (png csempék) szemben, itt vektoros adatok (vektoros csempék) vannak.
- A megjelenítéskor rugalmasan kezelhetőek a stílusok (style JSON segítségével).
- Kliens oldali renderelés (Open/Web GL alapon).
- Az adatok külön rétegek a térképen, nem képezik szerves és elválaszthatatlan részét.

Példa:
var map = new mapboxgl.Map({
  container: 'map',
  center: [47.47, 19.06],
  zoom: 15,
  style: style_object,
  hash: true
});
Adat: Vector Tile
A Vector Tile egy nyílt szabvány webes térképek adatainak kódolásához.


Elemzés: Turf.js
A térkép adatain elvégezhetünk különféle térinformatikai műveleteket és elemzéseket. Erre a célra szolgál a Turj.js nevű nyílt forráskódú JavaScript könyvtár, melyet a Mapbox is beépítetten használ. Néhány ilyen térinformatikai művelet a Turf.js képességei közül:
- Méretarány, mérték, távolságmérés kezelése
- Transzformáció (például: buffer terület, unió, metszet és különbség képzés)
- Pontok, poligonok és multipoligonok kezelése
- Interpoláció
- Adat osztályozás
- Mértékegység konverzió
- Rácsok, hálózatok elemzése
- Aggregációs és statisztikai függvények

Példa:
var poly1 = {
  "type": "Feature",
  "properties": {
    "fill": "#0f0"
  },
  "geometry": {
    "type": "Polygon",
    "coordinates": [[
      [-82.574787, 35.594087],
      [-82.574787, 35.615581],
      [-82.545261, 35.615581],
      [-82.545261, 35.594087],
      [-82.574787, 35.594087]
    ]]
  }
};
var poly2 = {
  "type": "Feature",
  "properties": {
    "fill": "#00f"
  },
  "geometry": {
    "type": "Polygon",
    "coordinates": [[
      [-82.560024, 35.585153],
      [-82.560024, 35.602602],
      [-82.52964, 35.602602],
      [-82.52964, 35.585153],
      [-82.560024, 35.585153]
    ]]
  }
};

var union = turf.union(poly1, poly2);
Komponensek közötti kapcsolat
A Mapbox, illetve annak webes Mapbox.js nevű megoldása, ezen különálló komponensek egyfajta "wrapper" megvalósítása az egyszerűbb és egységesebb kezelhetőség érdekében.


Példák (Mapbox GL JS)
Minimális példa egy térkép megjelenítésére
<!-- Display a map -->
<!-- Initialize a map in an HTML element with Mapbox GL JS. -->

<!DOCTYPE html>
<html>
<head>
    <meta charset='utf-8' />
    <title></title>
    <meta name='viewport' content='initial-scale=1,maximum-scale=1,user-scalable=no' />
    <script src='https://api.tiles.mapbox.com/mapbox-gl-js/v0.37.0/mapbox-gl.js'></script>
    <link href='https://api.tiles.mapbox.com/mapbox-gl-js/v0.37.0/mapbox-gl.css' rel='stylesheet' />
    <style>
        body { margin:0; padding:0; }
        #map { position:absolute; top:0; bottom:0; width:100%; }
    </style>
	<script>
		var demoAccessToken = 'pk.eyJ1IjoibWFwYm94IiwiYSI6ImNpejh2N21nMzAxMmQzMnA5emRyN2lucW0ifQ.jSE-g2vsn48Ry928pqylcg' || 'pk.eyJ1IjoibWFwYm94IiwiYSI6ImNpejY4M29iazA2Z2gycXA4N2pmbDZmangifQ.-g_vE53SD2WrJ6tFX7QHmA';
	</script>
</head>
<body>

<div id='map'></div>
<script>
mapboxgl.accessToken = '<your access token here>';
mapboxgl.accessToken = demoAccessToken;
var map = new mapboxgl.Map({
    container: 'map', // container id
    style: 'mapbox://styles/mapbox/streets-v9', //stylesheet location
    center: [19.06, 47.47], // starting position
    zoom: 15 // starting zoom
});
</script>

</body>
</html>
Vector tile forrás hozzáadása a térképhez
<!-- Add a vector tile source -->
<!-- Add a vector source to a map. -->

<!DOCTYPE html>
<html>
<head>
    <meta charset='utf-8' />
    <title></title>
    <meta name='viewport' content='initial-scale=1,maximum-scale=1,user-scalable=no' />
    <script src='https://api.tiles.mapbox.com/mapbox-gl-js/v0.37.0/mapbox-gl.js'></script>
    <link href='https://api.tiles.mapbox.com/mapbox-gl-js/v0.37.0/mapbox-gl.css' rel='stylesheet' />
    <style>
        body { margin:0; padding:0; }
        #map { position:absolute; top:0; bottom:0; width:100%; }
    </style>
	<script>
		var demoAccessToken = 'pk.eyJ1IjoibWFwYm94IiwiYSI6ImNpejh2N21nMzAxMmQzMnA5emRyN2lucW0ifQ.jSE-g2vsn48Ry928pqylcg' || 'pk.eyJ1IjoibWFwYm94IiwiYSI6ImNpejY4M29iazA2Z2gycXA4N2pmbDZmangifQ.-g_vE53SD2WrJ6tFX7QHmA';
	</script>
</head>
<body>

<div id='map'></div>
<script>
mapboxgl.accessToken = '<your access token here>';
mapboxgl.accessToken = demoAccessToken;
var map = new mapboxgl.Map({
    container: 'map',
    style: 'mapbox://styles/mapbox/light-v9',
    zoom: 15,
    center: [19.06, 47.47]
});

map.on('load', function () {

    map.addLayer({
        "id": "terrain-data",
        "type": "line",
        "source": {
            type: 'vector',
            url: 'mapbox://mapbox.mapbox-terrain-v2'
        },
        "source-layer": "contour",
        "layout": {
            "line-join": "round",
            "line-cap": "round"
        },
        "paint": {
            "line-color": "#ff69b4",
            "line-width": 1
        }
    });
});
</script>
</body>
</html>
Külső forrásból származó vector tile hozzáadása a térképhez
Add a third party vector tile source
<!-- Add a third party vector tile source -->
<!-- Render a map using an external vector source of OpenStreetMap data provided by Mapzen. -->

<!DOCTYPE html>
<html>
<head>
    <meta charset='utf-8' />
    <title></title>
    <meta name='viewport' content='initial-scale=1,maximum-scale=1,user-scalable=no' />
    <script src='https://api.tiles.mapbox.com/mapbox-gl-js/v0.37.0/mapbox-gl.js'></script>
    <link href='https://api.tiles.mapbox.com/mapbox-gl-js/v0.37.0/mapbox-gl.css' rel='stylesheet' />
    <style>
        body { margin:0; padding:0; }
        #map { position:absolute; top:0; bottom:0; width:100%; }
    </style>
	<script>
		var demoAccessToken = 'pk.eyJ1IjoibWFwYm94IiwiYSI6ImNpejh2N21nMzAxMmQzMnA5emRyN2lucW0ifQ.jSE-g2vsn48Ry928pqylcg' || 'pk.eyJ1IjoibWFwYm94IiwiYSI6ImNpejY4M29iazA2Z2gycXA4N2pmbDZmangifQ.-g_vE53SD2WrJ6tFX7QHmA';
	</script>
</head>
<body>

<div id='map'></div>
<script>
mapboxgl.accessToken = '<your access token here>';
mapboxgl.accessToken = demoAccessToken;
var simple = {
    "version": 8,
    "sources": {
        "osm": {
            "type": "vector",
            "tiles": ["https://tile.mapzen.com/mapzen/vector/v1/all/{z}/{x}/{y}.mvt?api_key=vector-tiles-LM25tq4"]
        }
    },
    "layers": [
        {
            "id": "background",
            "type": "background",
            "paint": {
                "background-color": "#41afa5"
            }
        }, {
            "id": "water",
            "type": "fill",
            "source": "osm",
            "source-layer": "water",
            "filter": ["==", "$type", "Polygon"],
            "paint": {
                "fill-color": "#3887be"
            }
        }
    ]
};

var map = new mapboxgl.Map({
    container: 'map',
    style: simple,
    zoom: 1,
    center: [-14, 35]
});

map.addControl(new mapboxgl.NavigationControl());
</script>
</body>
</html>
Felhasználás, alkalmazás
A Foursquare is Mapbox-ra váltott
A Foursquare 2012-ben lecserélte a Google térképszolgáltatására épülő webes felületét egy Mapbox alapú verzióra. Ezzel az újítással a felhasználók már egy színesebb, több információt tartalmazó térképpel találkozhatnak a Foursquare weboldalán. Mindezzel együtt a térképes adatok, képek szolgáltatását sem a Google Maps biztosítja, hanem a szintén népszerű OpenStreetMap. Az OpenStreetMap térképei a világ legtöbb pontján, így Magyarországon is nagyon pontosak és részletesek, és mivel nyílt rendszerről van szó, semmi sem akadályozza a folyamatos fejlődést.
Mapbox és WordPress: látványos térképek WordPress oldalon kódolás nélkül
Hivatalos bővítmény
Elavult verziójú, feltehetően nem fejlesztik tovább.
Harmadik féltől származó bővítmény

Harmadik féltől származó bővítmény
A Mapbox for Wordpress Advanced nevű WordPress bővítménnyel egyszerűen lehet térképeket hozzáadni egy WordPress oldalhoz. Ehhez nem kell mást tenni, mint letölteni a bővítményt az alábbi linken:
Mapbox for Wordpress Advanded letöltése
Majd a bővítményt feltölteni az adott WordPress oldalra és aktiválni. Ezután egy meglévő Mapbox felhasználói fiókon keresztül Mapbox Studio Classic használatával elkészíthető a kívánt térkép. Végül az elkészített térképhez tartozó Access Token-t és térkép ID-t meg kell adni a Mapbox for Wordpress Advanced bővítménynek.
Mapbox működés közben egy WordPress oldalon
További érdekességek
Térkép a Twitter első 6 milliárd geotaggel ellátott fotója alapján
Egy speciális világatlaszt készített a nagyvárosokról Eric Fischer, a Mapbox fejlesztője, aki a Twitter indulása óta megosztott összes geotaggel, vagyis földrajzi koordinátákkal ellátott több mint 6 milliárd bejegyzést használta fel hozzá. Első körben azt vizsgálta, hogy melyek azon régiók, kerületek, ahol a legsűrűbben fotóznak.
Twitteres geotaggel ellátott fotók térképe

A projektet továbbgondolva Fischer megkülönböztette a képeket készítő helybelieket a turistáktól. Így létrejött a Locals and Tourists nevű projektje, melynek keretében már azt is elkülönítette, hogy a képeket helybeliek vagy turisták készíthették.
Kék a helyi lakos, piros a turista Fischer azokat a személyeket számolta helyi lakosnak, aki egy hónapnál hosszabb ideje készít földrajzi címkékkel rendelkező fotókat egy adott térségben: őket jelölte kék színnel. A pirossal kiemelt turista kategóriába azok tartoznak, akik egy hónapnál kevesebb ideig készítettek és osztottak meg egy helyszínről képeket. A sárga pontok alatt azokat kell érteni, akiknél mindez nem volt egyértelműen meghatározható.
Budapest térképrészletére tekintve a legnépszerűbb turistacélpontok között a Hősök tere, a Városliget, a Lánchíd, és a Gellért-hegy is jól látható.
Átdolgozott, teljesértékű interaktív világtérképre bővített verzió:
Twitter Locals and Tourists project